Theoretical Framework
The FdR-BIM performance measurement, impact assessment and benchmarking project adopts a comprehensive, systemic and systematic approach integrating the Triple Bottom Line framework (economic, environmental, social) and ESG criteria (Environmental, Social, Governance).
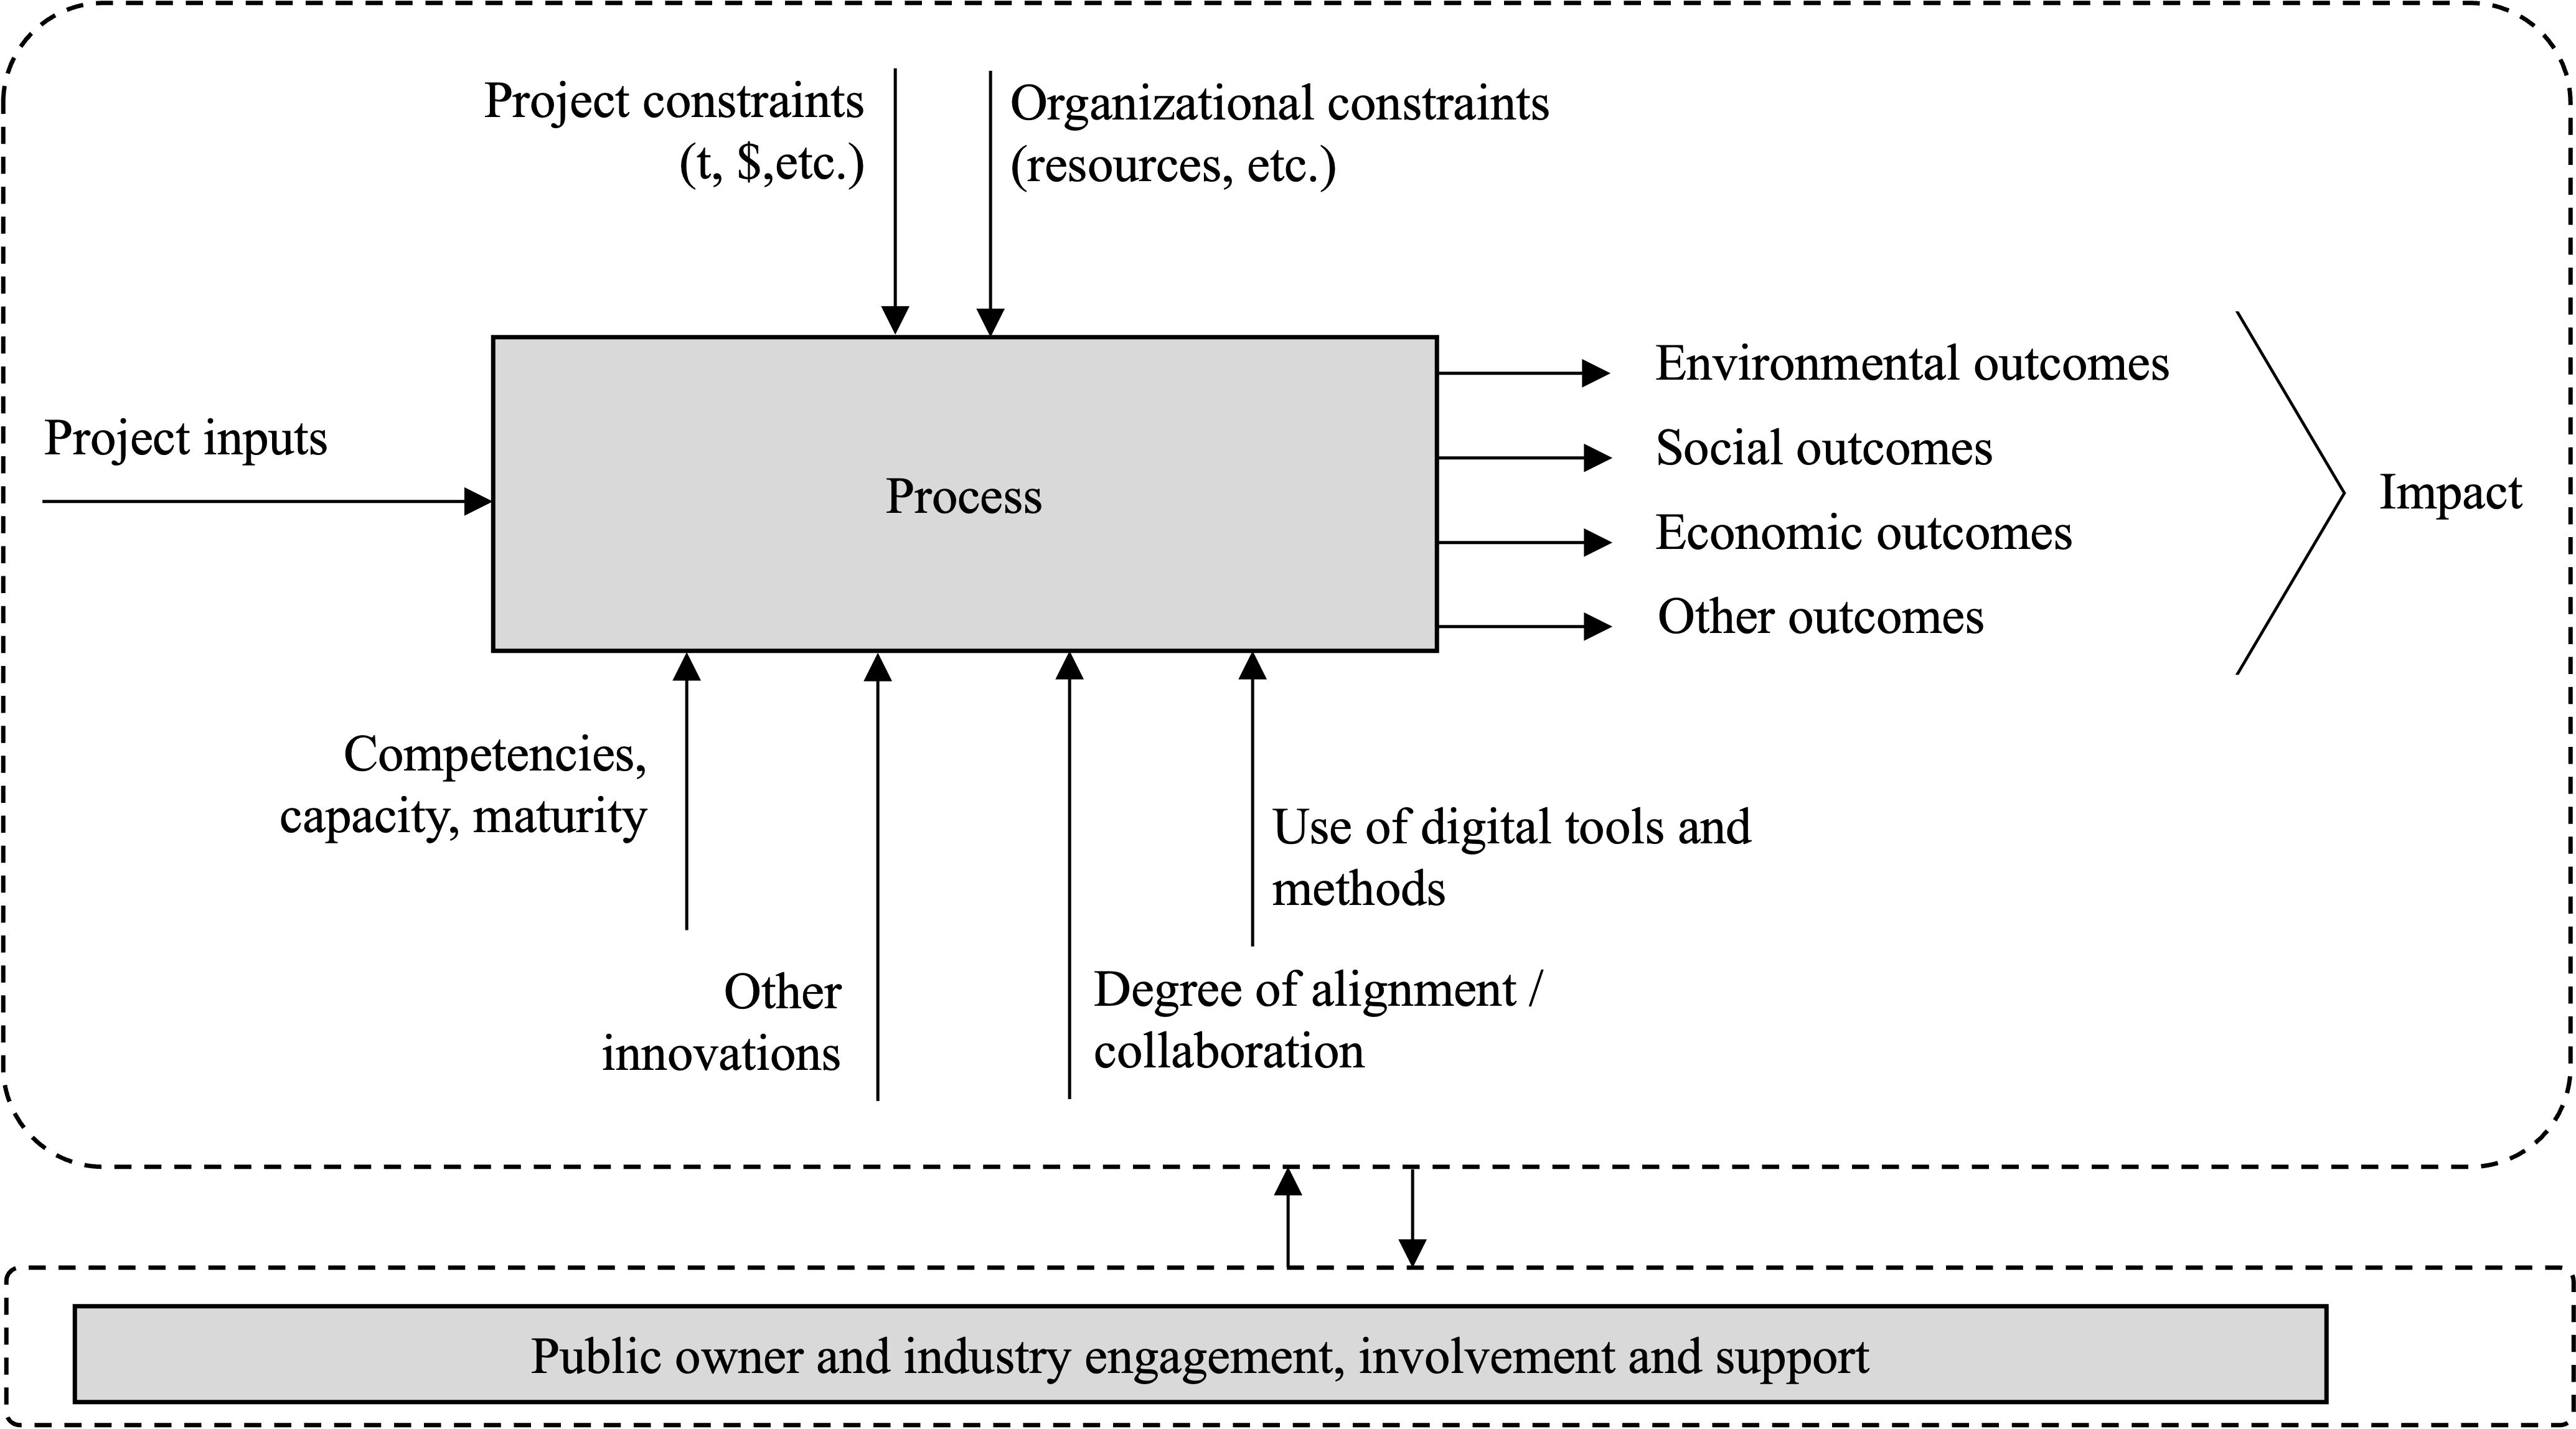
Theoretical framework for performance measurement, impact assessment and benchmarking (Adapted from Rankin et al., 2008)
The framework considers:
- Project inputs — Initial project resources and data
- Project delivery system — Orchestrated structures, processes, actors and artifacts
- Project constraints (time, cost, etc.) and organizational constraints (resources, etc.)
- Mechanisms — Competencies/capacity/maturity, use of digital tools, degree of collaboration, other innovations
- Outcomes — Environmental, social, economic and other results
- Impact — Long-term effects measured through the impact value chain
Priority Performance Indicators
The following 17 priority measures have been identified and validated by public owner organizations (POOs) for deployment across all FdR-BIM pilot projects.
| Indicator | Measure | Description |
|---|---|---|
| Cost | Cost predictability | Variance between actual cost and initial estimate (%) |
| Cost | Cost per unit | Average cost per installed unit ($/m², $/km, etc.) |
| Time | Duration predictability | Variance between actual duration and initial estimate (%) |
| Time | Time per unit | Average installation time per unit |
| Productivity | Labor productivity | Productivity measured in $/unit completed |
| Quality | Stakeholder satisfaction | Level of satisfaction with final product |
| Safety | Lost time incidents | Time lost due to incidents / 100,000 hours |
| Scope | Change orders (cost) — client | Client-initiated changes (% of cost) |
| Scope | Change orders (cost) — contractor | Contractor-initiated changes (% of cost) |
| Scope | Change orders — client | Total number of change orders (client) |
| Scope | Change orders — contractor | Total number of change orders (contractor) |
| Scope | Requests for information (RFI) | Number of formal information requests |
| Risk | Risk exposure | Total amount and score of identified risks |
| Risk | Risk mitigation cost | Total budgeted mitigation cost |
| Sustainability | Waste production | Volume of waste generated vs targets |
| Sustainability | Carbon footprint | GHG emissions (CO₂ equivalent) |
| Sustainability | Energy consumption | Energy used (kWh) vs estimates |
Complete Set of Identified Indicators
The following 43 measures were identified through literature review and interviews with POOs. They cover 9 key performance indicator categories.
1. Cost
| ID | Measure | Description |
|---|---|---|
| 1.1 | Cost predictability | Difference between actual cost and estimate at a key milestone, expressed as percentage |
| 1.2 | Cost per unit (estimated and actual) | Average cost of an installed product or system ($/km, $/m²) |
| 1.3 | Operating cost | Annual operation and maintenance cost after completion, as % of construction cost |
2. Time
| ID | Measure | Description |
|---|---|---|
| 2.1 | Duration predictability | Difference between actual duration and initial estimate, expressed as percentage |
| 2.2 | Time per unit (estimated and actual) | Average installation time for a product or system (hours/m, days/m²) |
3. Productivity
| ID | Measure | Description |
|---|---|---|
| 3.1 | Labor productivity — $/unit | Productivity measured in dollars per completed unit |
| 3.2 | Labor productivity — unit/hour | Productivity measured in units per hour |
| 3.3 | Decision latency | Average time between decision initiation and final decision |
4. Quality
| ID | Measure | Description |
|---|---|---|
| 4.1 | Stakeholder satisfaction | Level of satisfaction with final product after defect resolution |
| 4.2 | Quality issues (punch list) | Total number of non-conformities identified at substantial completion |
| 4.3 | Defect cost — warranty | Cost of rectifying defects during warranty period (% of construction cost) |
| 4.4 | Defect resolution time — warranty | Time taken to rectify all defects during warranty period |
| 4.5 | Rework rate | Proportion of work requiring rework after substantial completion |
5. Safety
| ID | Measure | Description |
|---|---|---|
| 5.1 | Reportable incidents | Number of reported incidents / 100,000 hours worked |
| 5.2 | Lost time incidents | Time lost due to incidents / 100,000 hours worked |
6. Scope
| ID | Measure | Description |
|---|---|---|
| 6.1 | Change order (Cost) — client | Client-attributable changes, as % of estimated construction cost |
| 6.2 | Change order (Cost) — contractor | Contractor-attributable changes, as % of estimated construction cost |
| 6.3 | Change order (Time) — client | Client-attributable duration changes, as % of estimated duration |
| 6.4 | Change order (Time) — contractor | Contractor-attributable duration changes, as % of estimated duration |
| 6.5 | Change orders — client | Total number of client-initiated change orders |
| 6.6 | Change orders — contractor | Total number of contractor-initiated change orders |
| 6.7 | Number of claims | Total number of claims submitted/recorded |
| 6.8 | Total claim amount | Ratio of total awarded claim costs |
| 6.9 | Requests for information (RFI) | Number of formal information requests issued |
7. Risk
| ID | Measure | Description |
|---|---|---|
| 7.1 | Number of quantified risks | Total number of risks identified for a project |
| 7.2 | Risk exposure | Risk profile characterized by total amount and score (severity × probability) |
| 7.3 | Risk mitigation cost | Total budgeted risk mitigation cost |
| 7.4 | Risk materialization | Total cost of risks that materialized |
8. Sustainability
| ID | Measure | Description |
|---|---|---|
| 8.1 | Certification | Sustainability level assessed against standard practice checklist |
| 8.2 | Material consumption | Total quantity of materials used vs design estimates |
| 8.3 | Waste production | Volume of waste generated vs project or industry targets |
| 8.4 | Carbon footprint | Total GHG emissions (CO₂ equivalent) over lifecycle |
| 8.5 | Waste recycling rate | Proportion of waste recycled or reused (%) |
| 8.6 | Energy consumption | Energy used (kWh) compared to baseline estimates |
| 8.7 | Air pollution | Level of air pollutants (particulates, NOₓ, SOₓ) vs standards |
| 8.8 | Community impact | Social and environmental impact assessed through stakeholder feedback |
| 8.9 | Water pollution | Contaminants introduced to water bodies vs regulatory limits |
9. Innovation
| ID | Measure | Description |
|---|---|---|
| 9.1 | Procurement type | Non-standard procurement practices compared to standard practices |
| 9.2 | Management innovation | Non-standard management practices compared to standard practices |
| 9.3 | Lean implementation index | Adoption of Lean principles (waste reduction, continuous improvement) |
| 9.4 | BIM adoption level | Degree of BIM integration measured by uses and actors involved |
| 9.5 | Collaboration index | Collaboration measured through survey of project actors |
| 9.6 | Technological innovation | New technologies deployed in project processes |
Project Publications
2025
Authors: Lerognon, V., Poirier, E., Hochscheid, E., & Hallin, G.
Publication: Proceedings of Smart and Sustainable Built Environment Conference Series, 186–195
Authors: Omar Maher & Erik Poirier
Publication: Joint CSCE Construction Specialty - CRC 2025
Authors: Seyed Mohammad Ehsan Tabatabaee, Luciana Gondim de Almeida Guimarães, Ivanka Iordanova, & Erik Poirier
Publication: Joint CSCE Construction Specialty - CRC 2025
Authors: Tabatabaee, S. M. E., Iordanova, I., & Poirier, E.
Publication: Proceedings of the Canadian Society for Civil Engineering Annual Conference 2024, Volume 3 (pp. 131–142). Springer Nature Switzerland.
Authors: Victoria Lerognon, Erik A. Poirier, Elodie Hochscheid, & Gilles Halin
Publication: Joint CSCE Construction Specialty - CRC 2025
Technical Reports
2026
Auteurs: Project team
Publication: Government BIM Roadmap — Activity 1.3.1: Identify Performance Indicators
2025
Authors: Victoria Lerognon & Erik Poirier
Publication: Government BIM Roadmap — Activity 3.1.3: Examine the current policy and regulatory framework and understand its effect on BIM implementation
Communications and Presentations
Coming soon